Client Background
Client is a global well-being company retailing, distributing and manufacturing a portfolio of leading international and home-grown brands across sport, food and health sectors.
Business Objective
- The client has both seasonal and core lines, with overall SKUs being more than 200,000 and over 500 retail stores. This SKUs also include products which are launched as New Product Initiatives
- This in turn, resulted in a non-traditional forecasting technique (machine learning)., having the ability to incorporate multiple external variables*, such as google mobility, weather events, covid, promotional flags, floating calendar etc.
Solution
The project was executed in 3 phases:
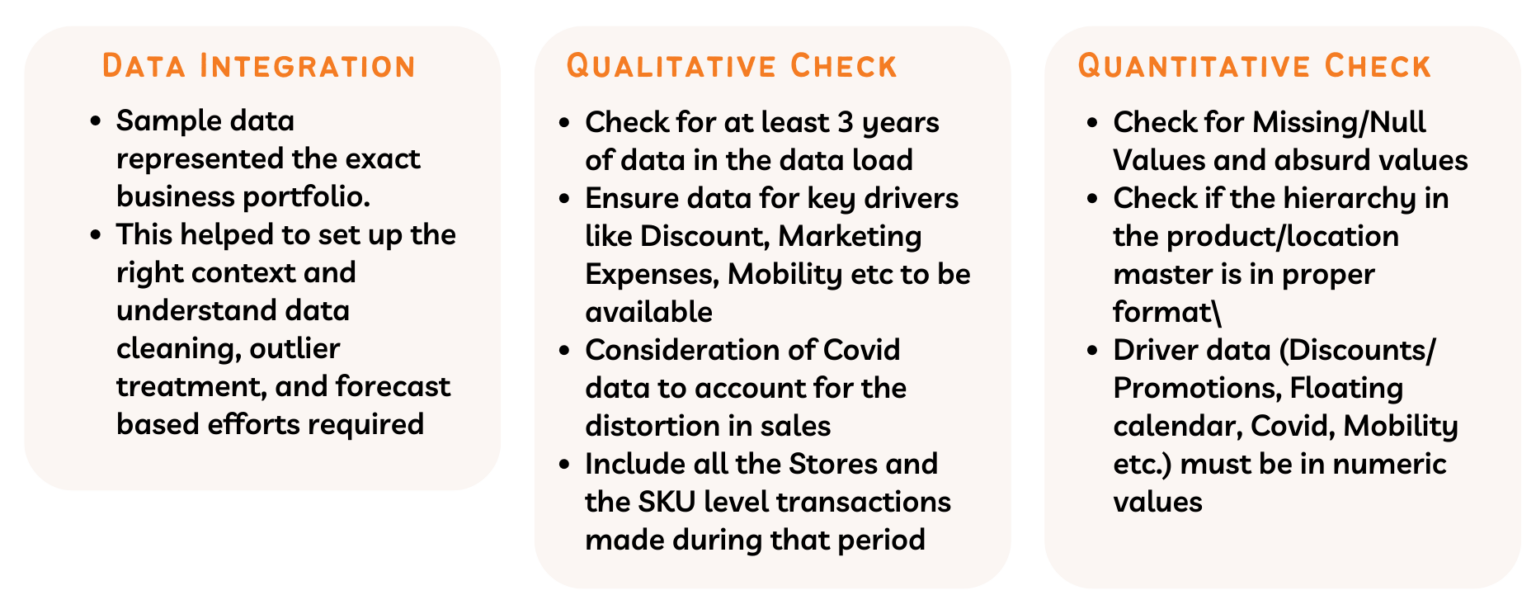
Phase 1: It consisted of the Data Collection and Harmonization –

Phase 2: It focused on the Exploratory Data Analysis & Segmentation –

Phase 3: ML model building/ iteration followed by model training & validation
The third and the final phase constituted of building and validating the ML models.
Following modeling techniques were used:
- Linear Regression: These models are easier to interpret and debug, so it is a good starting point.
- XGBoost: This is a tree-based approach and uses boosting technique. Boosting is a homogeneous weak learners’ model. learners learn sequentially and adaptively to improve model predictions of a learning algorithm.
- Random Forest: It uses bagging technique. It is also homogeneous weak learners’ model that learns from each other independently in parallel and combines them for determining the model average.
- Gradient Boosting
- Light Gradient Boosted Machine
Model validation in forecasting:
The dataset is divided into training and validation data sets. We go backward for some time period (say weeks) and try to forecast for the same time period using historical sales. Post which, we evaluate the model with the help of Actual sales vs Forecast Sales for the Validation data set
Below are some external variables that were taken into consideration:
- Macro-economic: GDP, Inflation, Industrial Production, Unemployment rate, Inverse exchange rate.
- Holiday Information: Festivals, National Holiday, other holiday
- Floating Calendar: Includes special event like sports league
- Promotional Details: Includes discounts and offers on Items
- Item level Information: SKU, style color, sub-class, category; item attributes: polo grey color
- Weather Information: Temperature, Wind speed, Humidity, Rain
- Marketing Spend: It considers expenses through various ways of marketing, for example digital media, traditional media , Brand events.
- Mobility Data from Google/Apple: Traffic of mobile phones over different places like parks, residential areas etc.
- Events happening (Sports)
- Special days: Thanksgiving Day, Christmas, new year, black Friday etc.
- Product Attributes: Size, color, design etc.
- Sales channel
- Store format
- Covid Data: Total confirmed cases/tested cases for any region
- Other specific variables: holiday calendar, promotions, markdown, Mobility Data from Google/Apple: Traffic of mobile phones over different places like parks, residential areas etc.
Outcome
- 80% improvement in forecast accuracy
- 8X reduction in manual intervention
- 40% reduction in inventory value


