In today’s world, when everything is moving to the digital ecosystem, maintaining robust applications is always a challenge. Because of critical applications and use cases, it’s always tough to have an application which has zero downtime. Even big giants couldn’t save us from the famous Y2K problem.
Effectively, to have this minimal downtime, it’s always important to determine the cause of the problem as quickly as possible. For Web applications, there are always two phases from which a problem can be traced, i.e, frontend and backend applications.
In this article, we’ll primarily focus on how to trace backend application logs running on Kubernetes server.
Why choose Elasticsearch for backend logging?
So, when we talk of enterprise level solutions, we always move to tools which are best suited for safety and security. Elasticsearch is the most famous multitenant-capable full text search engine which comes with a user-friendly interface and gives other important features as well. Elasticsearch is mainly used for large microservice based applications, where concepts and logic are distributed across multiple microservices.
We always talk of ELK as a techstack, which stands for E- Elastic, L- Logstash and K-Kibana. Elastic, logstash and kibana are actually main pillars for Elasticsearch. We have an agent called Filebeat as well which is responsible for acting as a bridge between Kubernetes servers and Logstash.
Getting Started with ELK Stack
Let’s go over how to get started with the ELK stack on Kubernetes before getting into the configuration files and setup. To build up your logging system, you must do the following:
Prerequisites
- A running Kubernetes cluster
- Helm package manager installed
- kubectl command-line tool configured
- Access to pull images from Elastic’s container registry
Installation Steps
- Add the Elastic Helm repository
helm repo add elastic https://helm.elastic.co
helm repo update
- Install Elasticsearch
# Create a namespace for ELK stack
kubectl create namespace logging
# Install Elasticsearch using Helm
helm install elasticsearch elastic/elasticsearch \
–namespace logging \
–set minimumMasterNodes=1 \
–set replicas=1400;”>
- Install Kibana
helm install kibana elastic/kibana \
–namespace logging
- Install Filebeat
helm install filebeat elastic/filebeat \
–namespace logging
- Install Logstash
helm install logstash elastic/logstash \
–namespace logging
Verifying the Installation
Check if all pods are running correctly:
kubectl get pods -n logging
You should see pods for Elasticsearch, Kibana, Filebeat, and Logstash in a Running state. Accessing Kibana
By default, Kibana is exposed through a Kubernetes service. You can access it by:
1. Port forwarding:
kubectl port-forward service/kibana-kibana 5601:5601 -n logging
2. Visit http://localhost:5601 in your browser
Initial Configuration
Once you have access to Kibana:
- Create an index pattern to match your logs
○ Navigate to Stack Management → Index Patterns
○ Click “Create index pattern”
○ Use “filebeat-*” as your index pattern
○ Select “@timestamp” as the time field
- Basic Security Setup
○ Use the default elastic user credentials
○ It’s recommended to change the default password
○ Set up role-based access control for your team
Now that you have the basic installation and configuration complete, you can proceed with the detailed configuration files mentioned in the following sections.
How does the solution work?
So as I explained above, Elasticsearch as a solution can be used in terms of microservice based architecture. When different microservices are running on different pods in a kubernetes server, sending logs to a logging workspace like Kibana is actually a challenge. But Elasticsearch has a proper solution to tackle this challenge using different tools of ELK techstack.
Kubernetes Servers → Filebeat → Logstash → Kibana
1. Reading logs from Kubernetes server : An agent is required to bring the logs from Kubernetes server to Logstash. Filebeat acts as an agent in this case, we can install filebeat inside our kubernetes server and it will be responsible for reading logs from the server. In kubernetes, logs are stored inside /var/log/pods and /var/log/containers. This filebeat agent continuously reads logs from these locations and then dispatches logs to logstash.
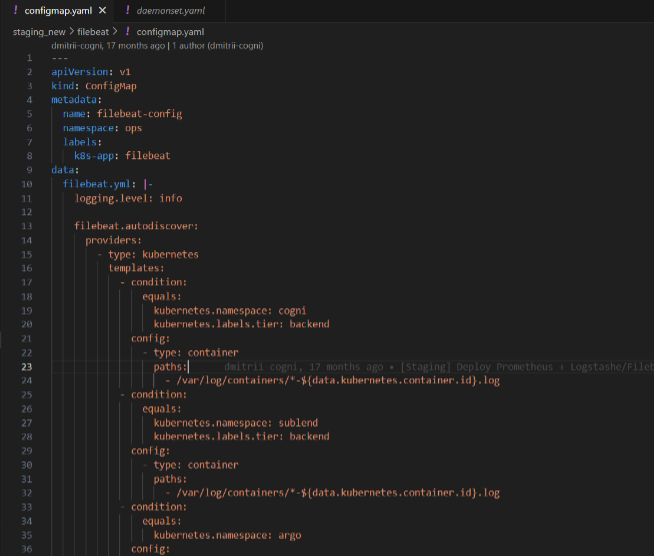
There are three files that need to be created for configuring filebeat within Kubernetes server.
a. Configmap.yaml : it specifies the configurations of file beat agent and specifies the output location to logstash pod as well.
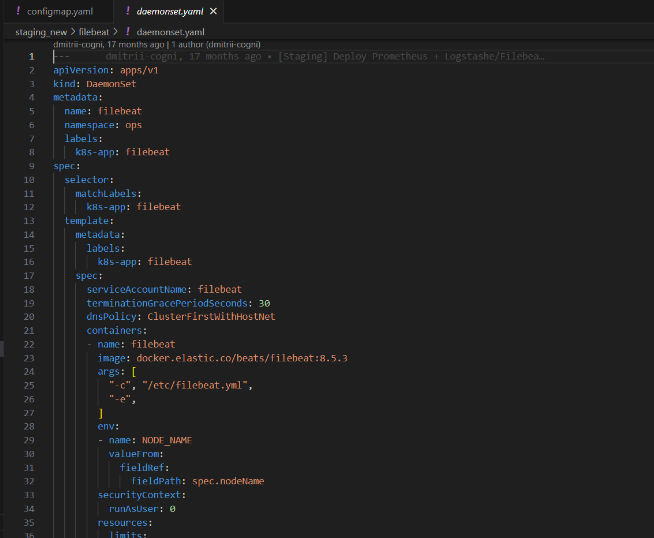
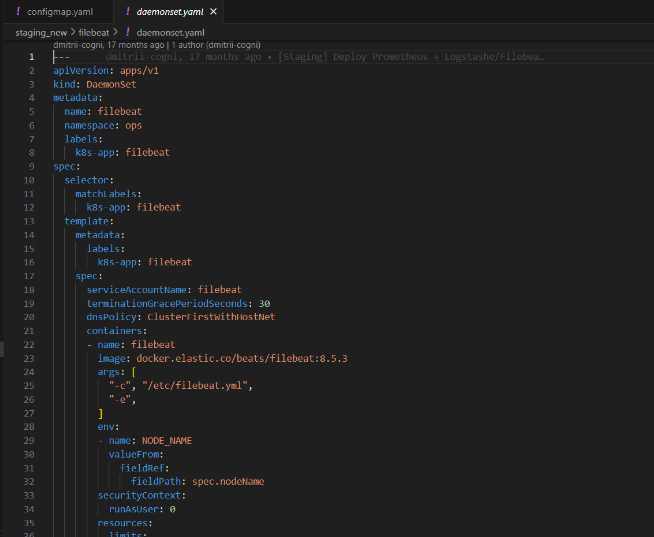
b. Daemonset.yaml : it specifies the specifications for file beat agent pod, like memory size etc.
c. Sa.yaml : this file is responsible for storing service account settings of the server.
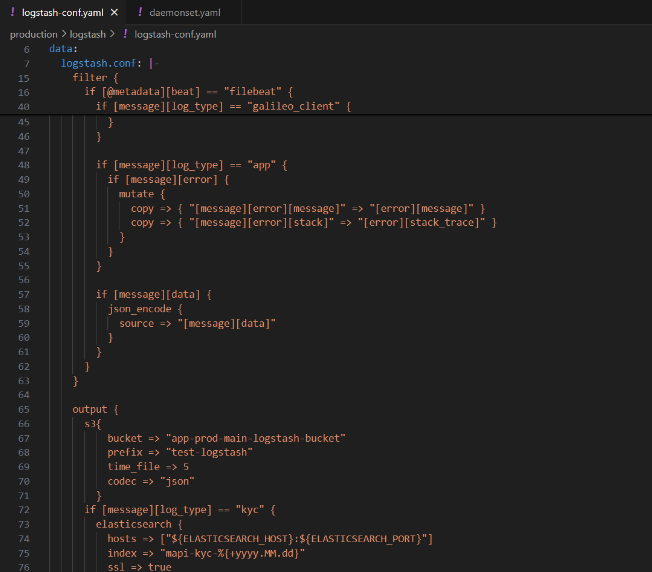
2. Logstash : Logstash is responsible for consuming logs from filebeat agents and then sends logs to Kibana dashboard. We connect to Elasticsearch inside logstash itself. Also, logstash is responsible for organizing the logs into different indexes so that we can easily classify logs from different microservices or we can organize them into high, low or medium priority logs.
There are three files that needs to be created for configuring logstash within Kubernetes server
a. Configmap.yaml : It specifies the configurations of logstash and also specifies the format in which logs are being organized inside the Kibana dashboard.
b. Daemonset.yaml : It is responsible for integration with elasticsearch cluster and also collects log streams from filebeat.
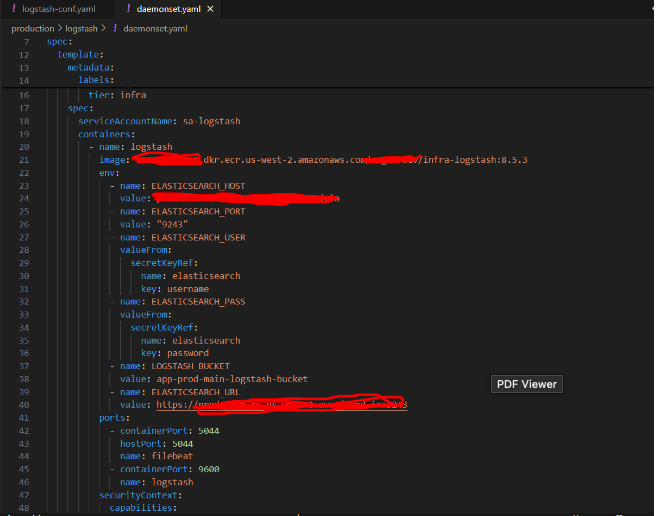
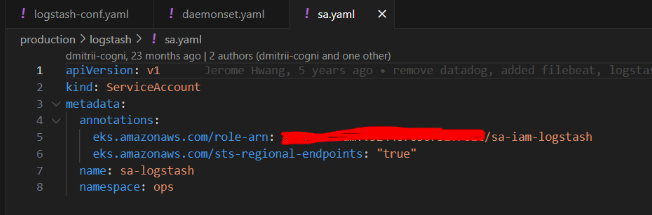
c. Sa.yaml : this file is responsible for storing service account settings of the server.
At this stage, we have made all required configurations in kubernetes server and now the configurations needs to be made inside Elasticsearch cluster.
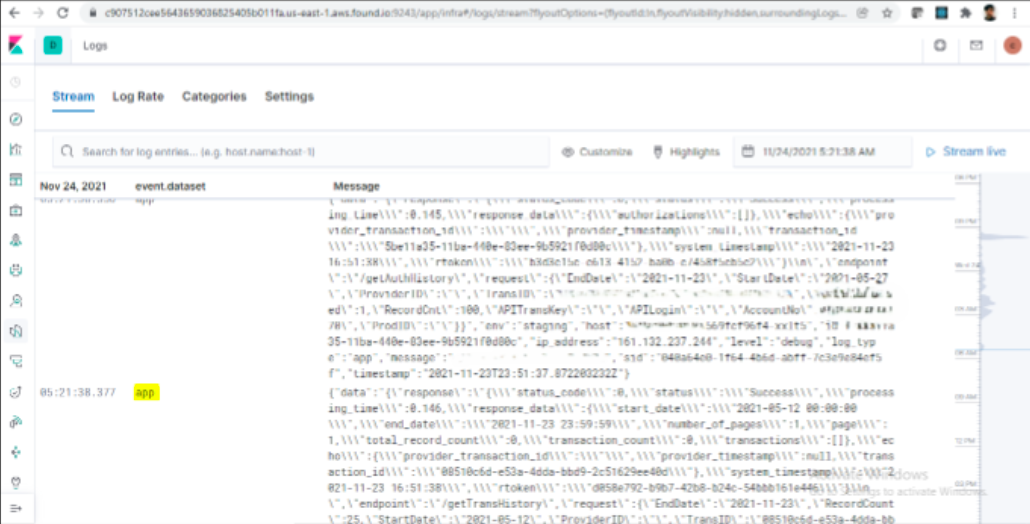
3. Kibana : Kibana is the user interface for viewing logs. It stores logs in different indices which helps in organizing and visualizing the logs in the more structured way. As Elasticsearch operates on non relational data, we can store data in any format inside Elasticsearch clusters.
When not to choose Elasticsearch?
Elasticsearch is an expensive tool and it should be used only if we are designing an enterprise level solution or if our application is following microservice based architecture.
But if we follow monolithic architecture, then using elasticsearch for storing centralized logs will be an expensive choice. Because monolithic applications often generate a large amount of log data, especially if it’s logging every request, error, or event we hardly emphasize on mapping logs in different indices. As monolithic applications generate too many logs, we have to always think about a scaling solution and scaling an Elasticsearch node can be costly. Also working with monolithic architecture, using this complex architecture of Filebeat 7 Logstash for sending logs to Kibana can sometimes be too much engineering as well.
Conclusion
Centralized logging with Elasticsearch and Kibana does more than just provide insight into your application’s inner workings; it serves as the foundation for a more resilient, agile, and data-driven environment. By leveraging the power of real-time insights, streamlined troubleshooting, and actionable metrics, you not only simplify log management but also enable your team to make faster, more informed decisions. As applications and data flows grow, a centralized logging setup can serve as a lighthouse, guiding you through complexity and keeping your systems on track. Are you ready to turn your logs into a competitive advantage? The journey begins with Elasticsearch and Kibana.

Chitrank Tyagi
Lead Software Engineer
Chitrank is a tech enthusiast, who loves to code and is fond of playing with AWS services. He believes one should never be afraid of taking the first step as, that one step can be a difference in transforming you to a better version of yourself.