
Reducing the volume of data transmitted for image classification is a crucial task, particularly when dealing with large quantities of images and the associated costs and network constraints. In our quest for an efficient and cost-effective solution, we have devised a comprehensive approach that leverages edge analytics and intelligent processing to minimize unnecessary data transmission. By implementing machine learning capabilities at the edge level and employing selective image analysis, we are able to significantly reduce the number of images sent to the cloud for classification. This not only optimizes resource utilization but also has the potential to reduce computational costs. In this article, we explore our methodology for reducing image data and the various approaches used to achieve accurate classification while mitigating the associated expenses.
Consider the scenario where a camera captures images at a rate of 2 frames per second, resulting in an overwhelming total of 7,200 images per hour and a staggering 172,800 images within a 24-hour period! Considering each image size to be around 600KB, a staggering 121 GB of data would be required for a single day. This amount of data is quite substantial and could lead to high costs and potential network congestion.
To address this challenge, one possible solution is to limit the data transmitted. By enabling smart cameras to perform image analysis locally, we significantly limit the amount of data sent to the cloud. Leveraging machine learning capabilities at the edge level, our intelligent processing begins by capturing a reference image, which serves as a benchmark for subsequent comparisons. Rather than transmitting every image, we adopt a selective approach. If subsequent images appear similar to the reference image, they are deemed redundant and not transmitted. However, if a change is detected, such as the presence of a new object, the corresponding image is then sent to the cloud for further analysis, ensuring that only relevant data is processed remotely.
To maintain accurate comparisons over time, we periodically update the reference image to adapt to changing lighting conditions. Every 15 minutes, a new reference image is captured, while every fourth week, a fresh set of reference images is created to account for variations in time. By incorporating these updates, we ensure precise and reliable classification results.

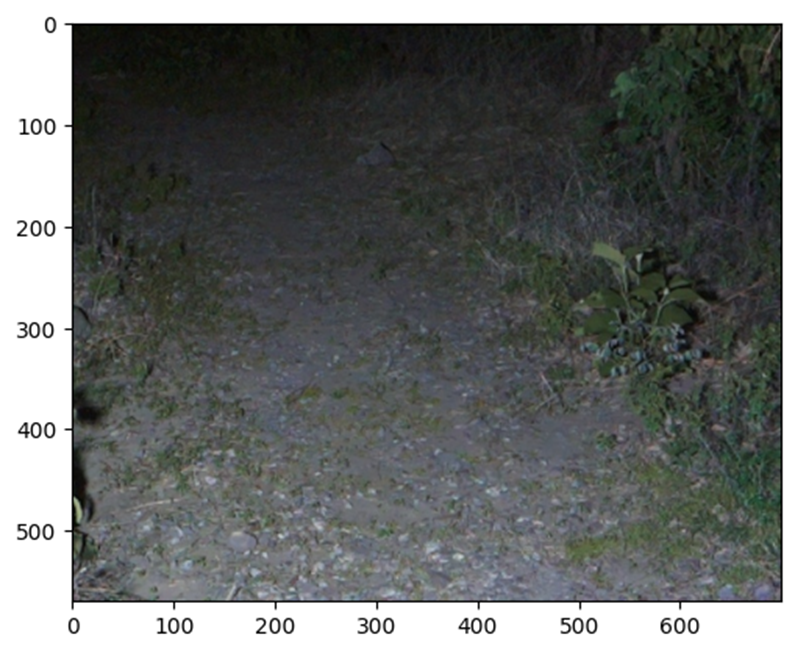
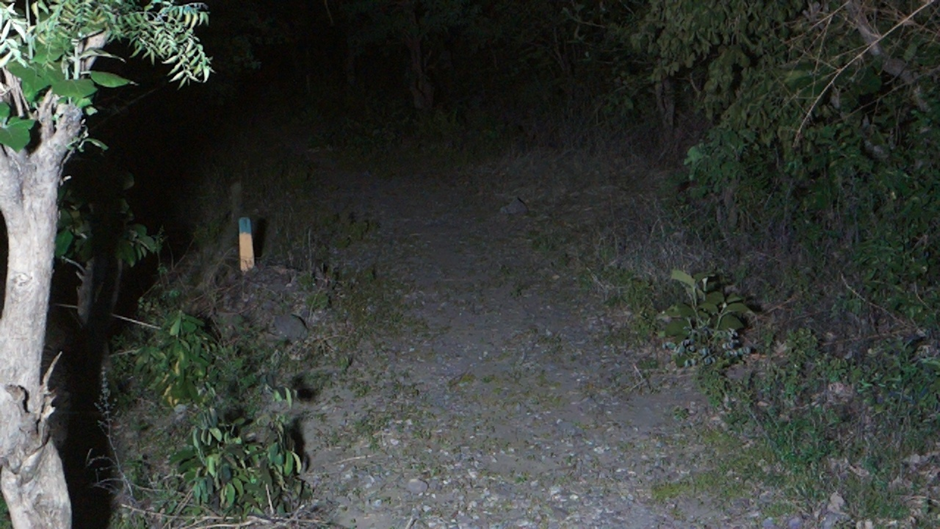
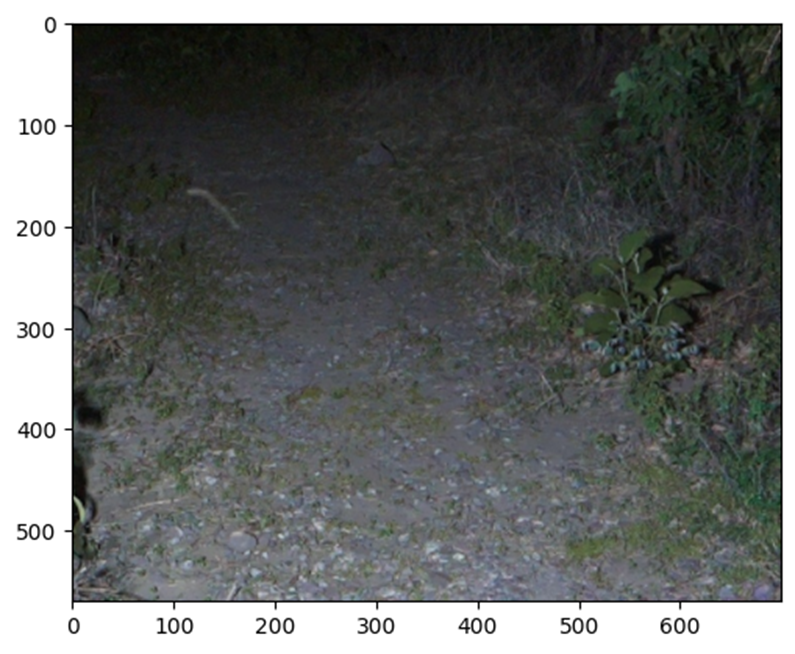
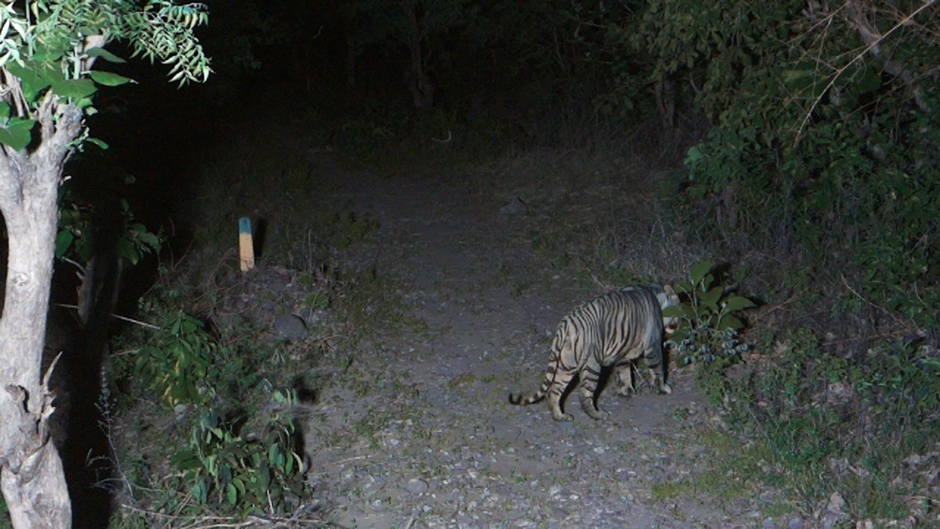
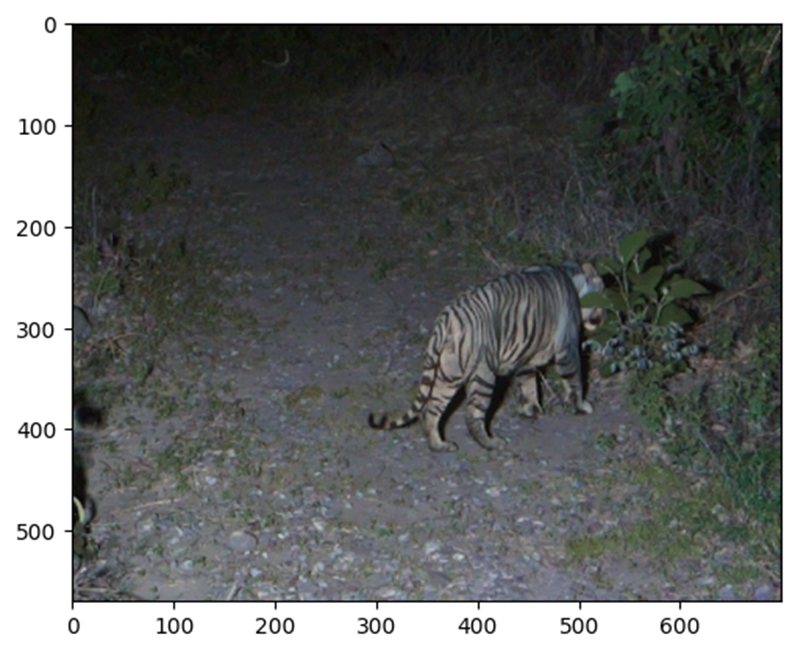
An important step in minimizing redundant image transmissions involves cropping specific areas of the images. Through careful observation, we have identified that the left and right sections of the images predominantly consist of plantations, making it highly unlikely for animals to traverse those regions. Additionally, the presence of insects in certain images, as depicted in Fig. 2.a., can lead to false interpretations of changes by the classification model. Therefore, we strategically crop the peripheral areas of the images, as shown in Figures 1.a., 2.a., and 3.a., effectively eliminating unnecessary image transmissions caused by leaf movement and insect appearances. This targeted cropping technique confines the transmission to only the essential parts of the images, further optimizing the data sent for analysis.
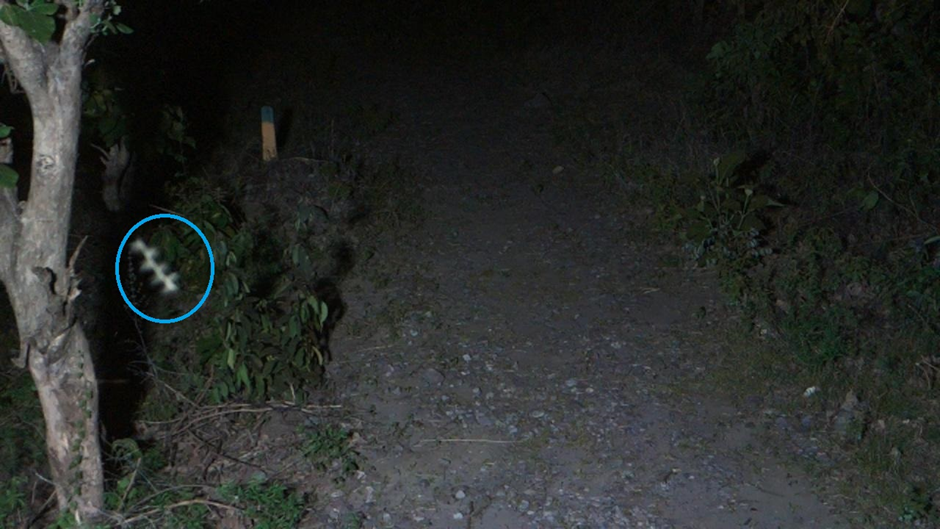
Furthermore, we employ a crucial principle in our data reduction strategy: no image is transmitted unless an object is detected. By examining Figures 1.a., 2.a., and 3.a., we can better grasp this concept. In the initial image (Fig. 1.a.), which serves as the reference, subsequent images like Fig. 2.a., while similar, do not contain any animals and therefore do not require transmission. However, in Fig. 3.a., where an animal is present, the image becomes a candidate for transmission. This selective approach ensures that only images capturing relevant objects are sent for further processing, significantly reducing the volume of data transmitted.
To enable the device to identify objects accurately, we have implemented several approaches, as depicted in Fig. 4. The first approach involves calculating the signal-to-noise ratio (SNR) of each image in comparison to the reference image. Fig. 5 showcases the distribution of SNR probability values. Notably, the orange line indicates a higher likelihood of SNR values between 20 and 40, which determines the images to be transmitted.
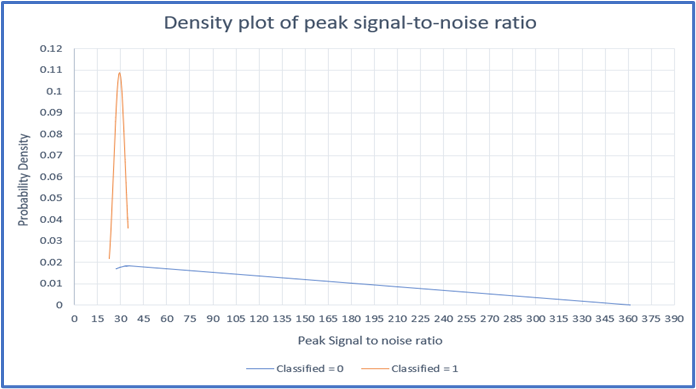
Conversely, SNR values beyond 40, as indicated by the blue lines, demonstrate a lower likelihood and therefore do not require transmission. This approach ensures that only images with significant changes relative to the reference are sent for further analysis, optimizing data usage.
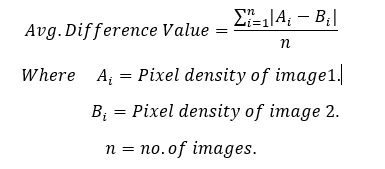
In the second approach, we utilize the density plot of peak difference values, as shown in Fig. 6. By calculating the average difference value, which represents the mean of absolute differences between two images, we can distinguish between classified and non-classified images. Images with average difference value greater than 4 are classified as significant changes and thus eligible for transmission, while those with value below 4 are considered non-classified and can be excluded from data transmission.
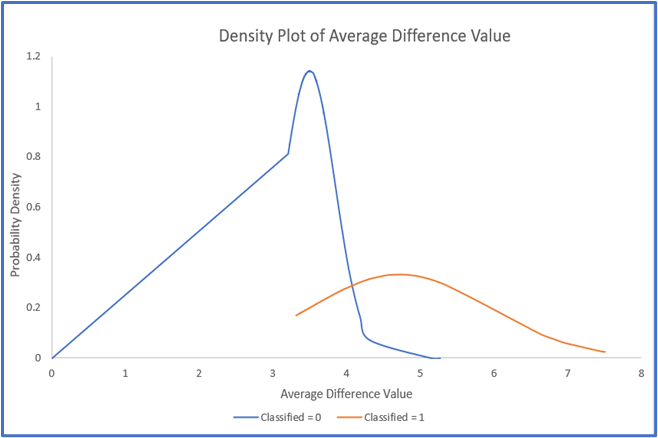
The Average difference value (mean of absolute differences between two images) are calculated as given in the following formula:
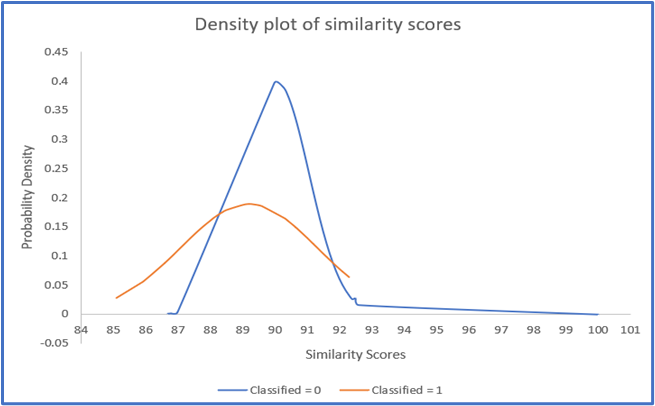
The third approach incorporates the density plot of similarity scores, illustrated in Fig. 7. Here, similarity scores are plotted against the probability density function. The images with high probability density values in the score range of 85 to 92 are selected for transmission as classified files, as denoted by the orange lines. This approach enables us to focus on transmitting images that exhibit distinct similarities to the reference, ensuring accurate classification results while minimizing data volume.
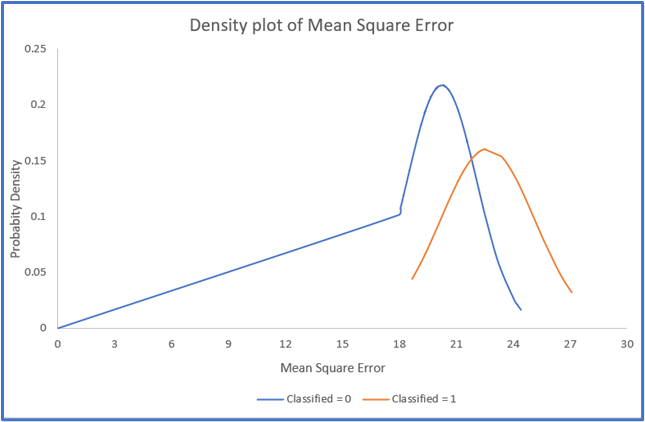
Lastly, we employ the density plot of mean square error (MSE) of images, as depicted in Fig. 8. By plotting the probability density against the MSE values, we identify the classified images within the MSE value range of 18 to 27, as they exhibit high probability density values. These images are deemed suitable for transmission, as they provide crucial data for accurate species classification.
Implementing these comprehensive approaches not only significantly reduces the amount of data transmitted but also yields cost-saving implications at the cloud level. By selectively transmitting images that capture relevant objects and changes, we minimize the computational resources required at the cloud. The reduced workload translates to efficient resource utilization, potentially lowering overall computational costs compared to the previous scenario where all 172,800 images or 121 GB of data were transmitted.
In conclusion, our data reduction strategy, implemented through edge analytics and intelligent processing, has successfully addressed the challenge of transmitting a massive volume of image data for species classification. By carefully selecting and optimizing the images sent to the cloud, we have achieved significant cost savings and improved overall efficiency. The combination of cropping peripheral areas, selective image transmission based on changes and object detection, and the utilization of various analytical approaches has paved the way for an optimized image classification system. As we continue to refine and enhance our methodologies, we anticipate even greater advancements in reducing data transmission, minimizing costs, and maximizing the potential of image-based species classification.