Client Background
Client is a state-owned power distribution utility & service provider responsible for providing electricity to nearly 1.6 million customers.
Business Need
The client required real-time management of the grid infrastructure, which was quick, reliable and efficient. The client was using an OLTP (DB2) system with on-premise DB2 RDBMS infrastructure in the backend. A query to the DB2 database was required every time to extract data for any ad hoc data requirement or for analysis. The current infrastructure did not support MIS requirement and especially ad hoc analysis.
Moreover, keeping such a high volume of data in an OLTP system is not recommended since the cost of data management on disk takes over the query processing time. The only way to store/process more data in an OLTP system is to scale up vertically which is a costly affair.
Solution-Data Analytics Platform
Valiance proposed to develop scalable Data Lake on top of AWS cloud infrastructure that would allow different business units and stakeholders to access insights across multiple sources of information whenever required. This data analytics infrastructure would bring all the data at one place; perform ad hoc analysis and be future-ready for more sophisticated predictive analytics workloads leading to smarter operations. Proposed platform comprised of following key components.
- Data Lake (Amazon S3) to ingest and store datasets on an ongoing basis. This would allow BI and analytics team to request data as per their need. Any downstream applications can also feed from Data Lake.
- Process the data as and when required using AWS EMR (Elastic Map Reduce)
- Enable ad hoc query functionality over Data Lake in S3 using AWS Athena/AWS Redshift
- Create Dashboards to view reports of the trends as per most recent data in AWS Quicksight
Technical Architecture (based on AWS)
Key highlights of the solution
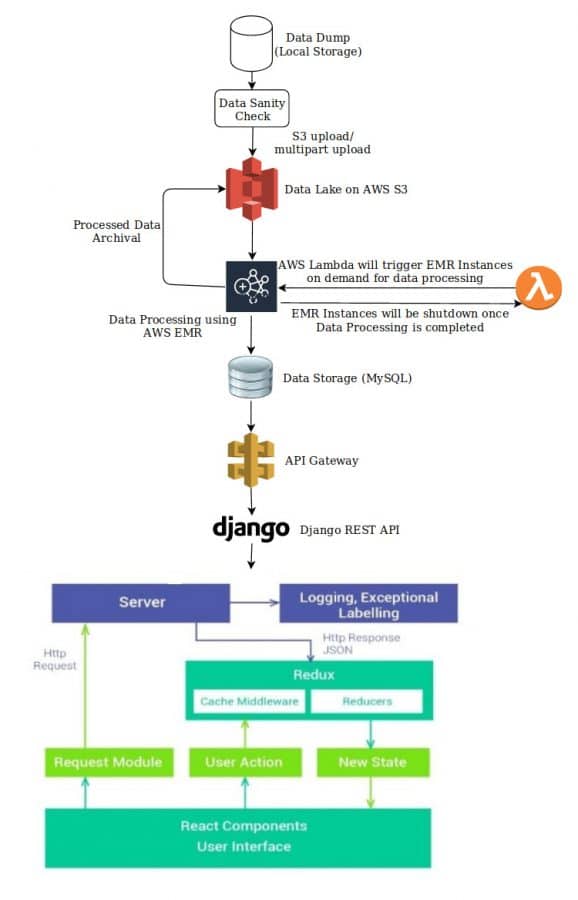
- Data lake needs to ingest both historical data and incremental data that DB2 will get in future. The first step was to extract the historical data from DB2. We used Sqoop for this purpose. Our team had several brainstorming sessions with the client in setting up timelines to execute the Sqoop jobs. These jobs were scheduled during after hours (night) when there is the least impact of Sqoop jobs on the existing applications. Once the data was extracted, the next step was to push the data to AWS S3. AWS Snowball service was used to push the one-time historical data into AWS S3.
- The next step was to handle the weekly incremental data. In this case, the team set up a CDC (Change Data Capture) process using Sqoop and Spark to push the weekly data into AWS S3 using S3 multipart upload. The Sqoop jobs were automated using bash scripts which would call Spark scripts (written in Python) to get the changed data weekly. Both these scripts were hosted on an on-premise Linux machine which was connected to AWS Cloud. Once the CDC process was complete, S3 multipart upload script was called to upload the data into the S3 data lake. The S3 multipart upload script was written in Python using the official boto3 library.
- Post data migration in S3, AWS EMR was used to process the data for insight generation. AWS Lambda scripts were then created to spin up the EMR cluster, run the data processing jobs written in Pyspark and then terminate the cluster when the job finishes. The output of EMR jobs was stored into two different sources. Frequently queried data was ingested into AWS Redshift for faster and effective query response while other data was kept in AWS S3 for an ad-hoc query using AWS Athena.
- The team automated the weekly data manipulation process via Python/Pyspark scripts. boto3 library was used to automate the AWS Cloud process. The official AWS Developers documentation was used as a reference for each of the component – AWS S3 and AWS Redshift for this purpose. Automation scripts were deployed into AWS Lambda and scheduled to execute the script at a mutually agreed time.
- AWS Quicksight was used to present the reporting data. The reports developed were populated with data within 10 seconds due to the current setup.


