Background
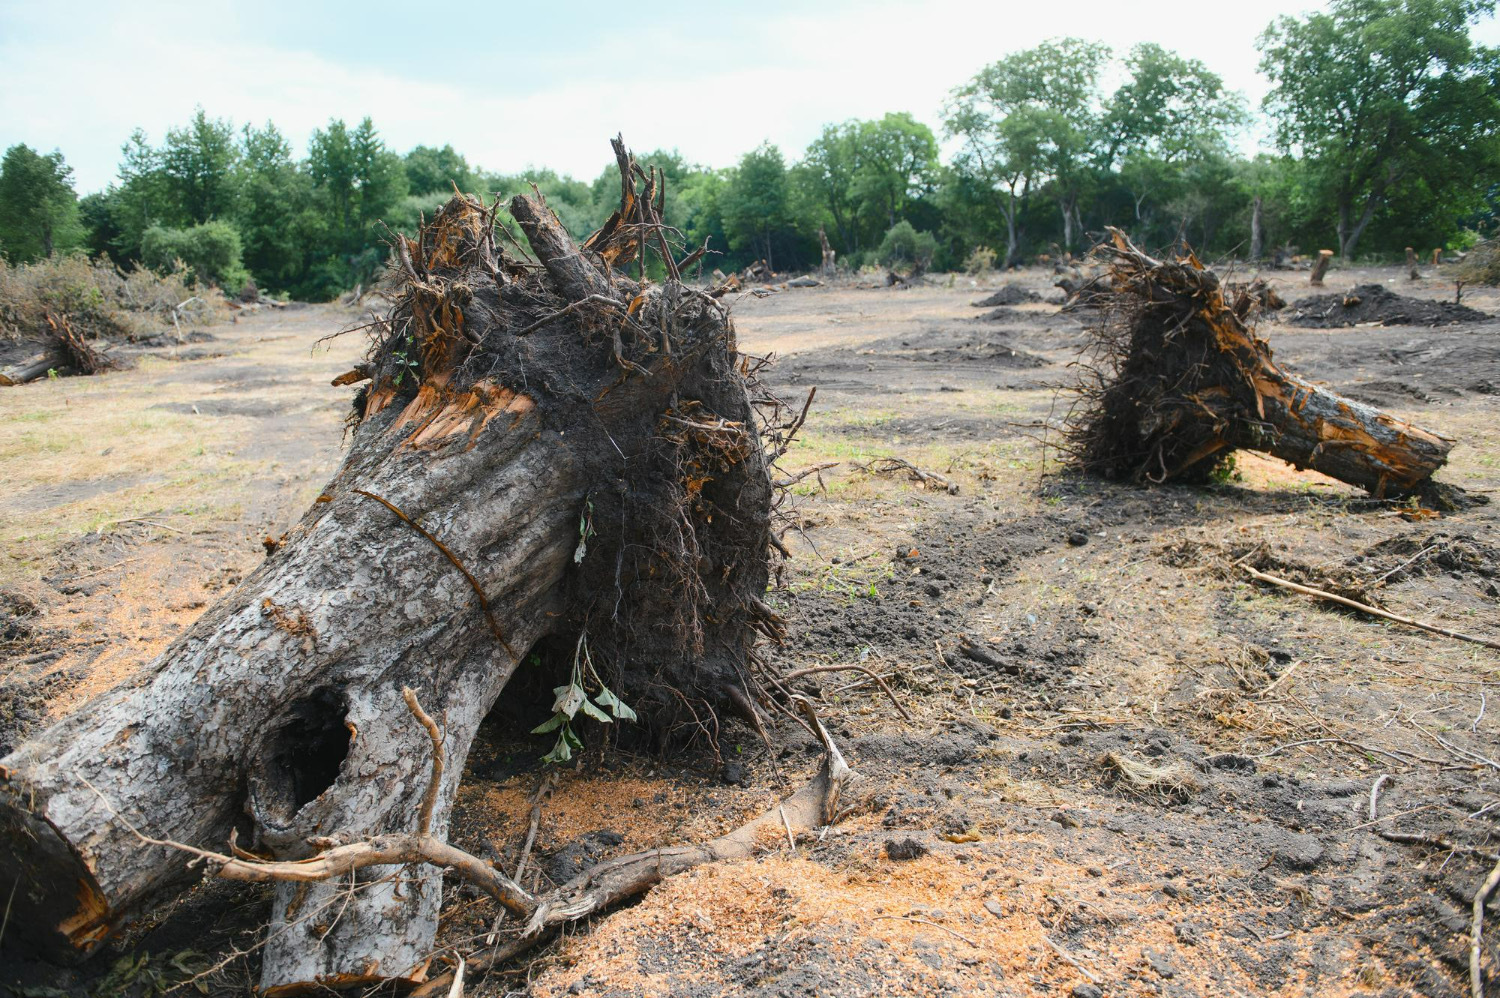
Forests have been a source of life and a backbone to the economy for us from the ancient ages. Even today, the need and the importance of forests needs no elaboration. While we humans migrated out of the forests, it’s still a home to a huge fraction of flora and fauna, a lot of which need our assistance to sustain in the coming generations. Tigers face the issues of poaching, shrinking habitats and other similar human-wildlife conflicts which has adversely affected its population in history. Even in the reserved and protected areas, we can observe deforestation for economic purposes.
Challenge
When it comes to detecting land usage or deforestation in a protected area, there is a general lack of solutions which can alert in real time. This results in severe and sustained losses, and sometimes the damage is beyond recovery. This not only affects the wildlife and ecology of the area, but it’s also a loss of culture, history and socio-economic value of the preserved land.
To counter this challenge, we’ve come up with a solution to detect deforestation and categorise it based on the land usage(farming or residence) in a specific area, and an alert system for the stakeholders. With the help of this deforestation detection system, actions can be taken in due time and we can move towards a sustainable future and stay true to our goals of nature and wildlife conservation.
Solution Approach
Tech Stack
- Shapefile Objects
- Google Earth Engine
- Python
- SQL
- Flask API
Shapefile Objects : The shapefile format is a digital vector storage format for storing geographic location and associated attribute information. It is possible to read and write geographical datasets using the shapefile format with a wide variety of software[1].
The shapefile format stores the geometry as primitive geometric shapes like points, lines, and polygons. These shapes, together with data attributes that are linked to each shape, create the representation of the geographic data. The term “shapefile” is quite common, but the format consists of a collection of files with a common filename prefix, stored in the same directory. The three mandatory files have filename extensions .shp, .shx, and .dbf. The actual shapefile relates specifically to the .shp file, but alone is incomplete for distribution as the other supporting files are required[1].
Mandatory files
- .shp — shape format; the feature geometry itself {content-type: x-gis/x-shapefile}
- .shx — shape index format; a positional index of the feature geometry to allow seeking forwards and backwards quickly
- .dbf — attribute format; columnar attributes for each shape, in dBase IV format
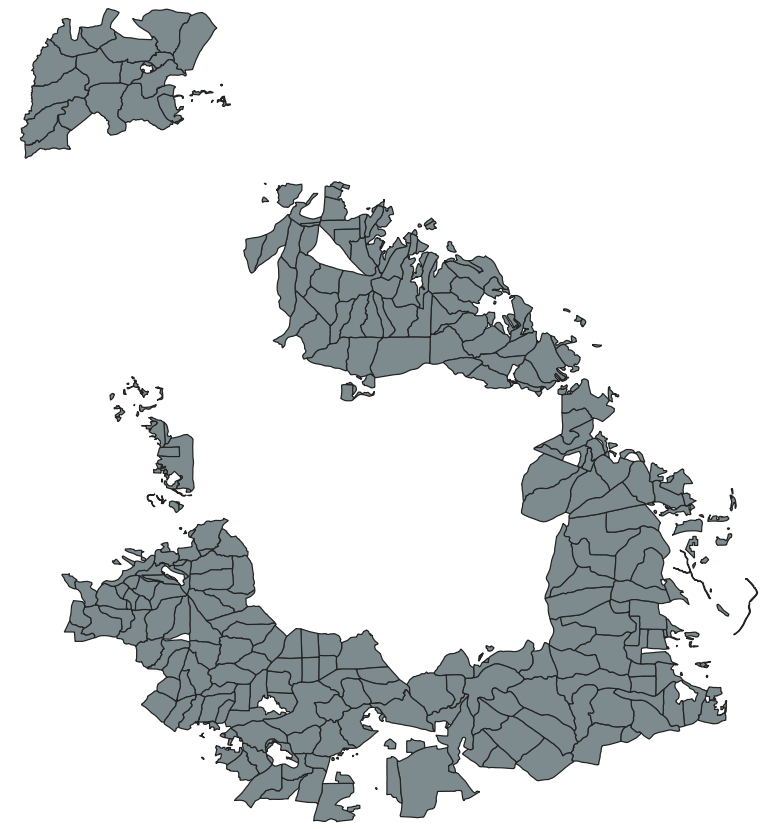
Fig 1 : Sample shapefile for an area(it is different from a normal jpeg image as it can store coordinates(latitude and longitude) of every point within the file)
Google Earth Engine : Google Earth Engine provides a vast catalogue of map datasets which can be used to observe various features of any point of interest. One such dataset is the Dynamic World V1 which is a 10m near-real-time (NRT) Land Use/Land Cover (LULC) dataset that includes class probabilities and label information for nine classes. These classes refer to different land usage such as water, trees, bare land and so on.
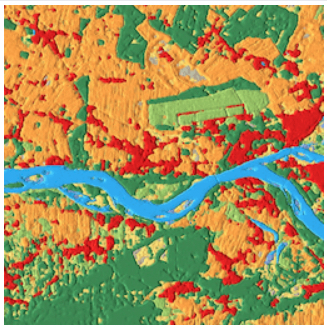
Fig 2 : A sample image from Dynamic World V1 data set, different colours indicate different land usage
The solution leverages the Dynamic World V1 dataset to get the images of the land piece of interest.
Procedure
The whole area we want to observe is distributed into smaller rectangular pieces to be analysed individually. For the current implementation, we’re dividing the sample shapefile(Fig 1 in 20 equal pieces). This results in higher quality images from Earth Engine and a more accurate result. In order to detect deforestation, we can compare an image of a place with an image of the same place from a certain time period back(let’s say we want to check the difference for a month).
First thing we do is we use the Earth Engine API to get the following 3 images:
- forest cover for the previous month
- forest cover for the current month
- crop cover for the current month
The area covered in each box is ~132 km2 (11.88km x 11.16km) and the size of each image obtained from Earth Engine for a box is 1512×1335 pixels.
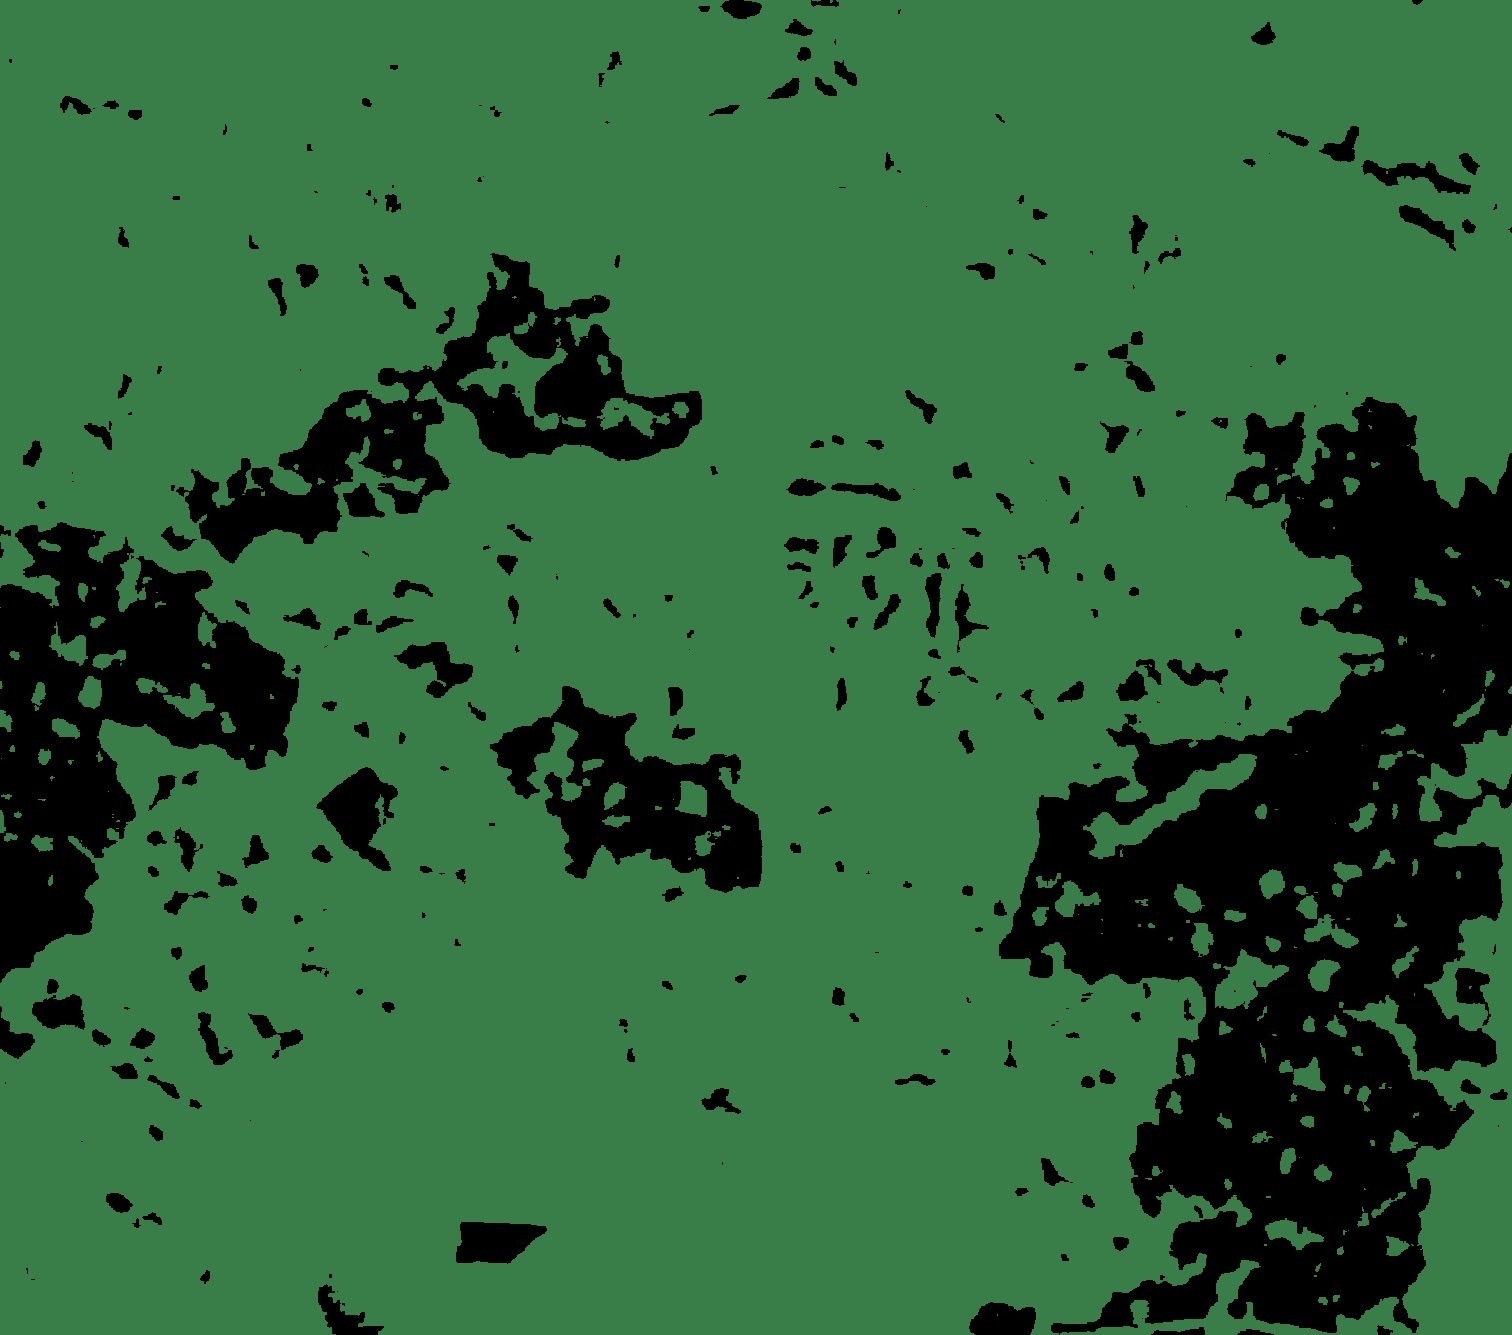
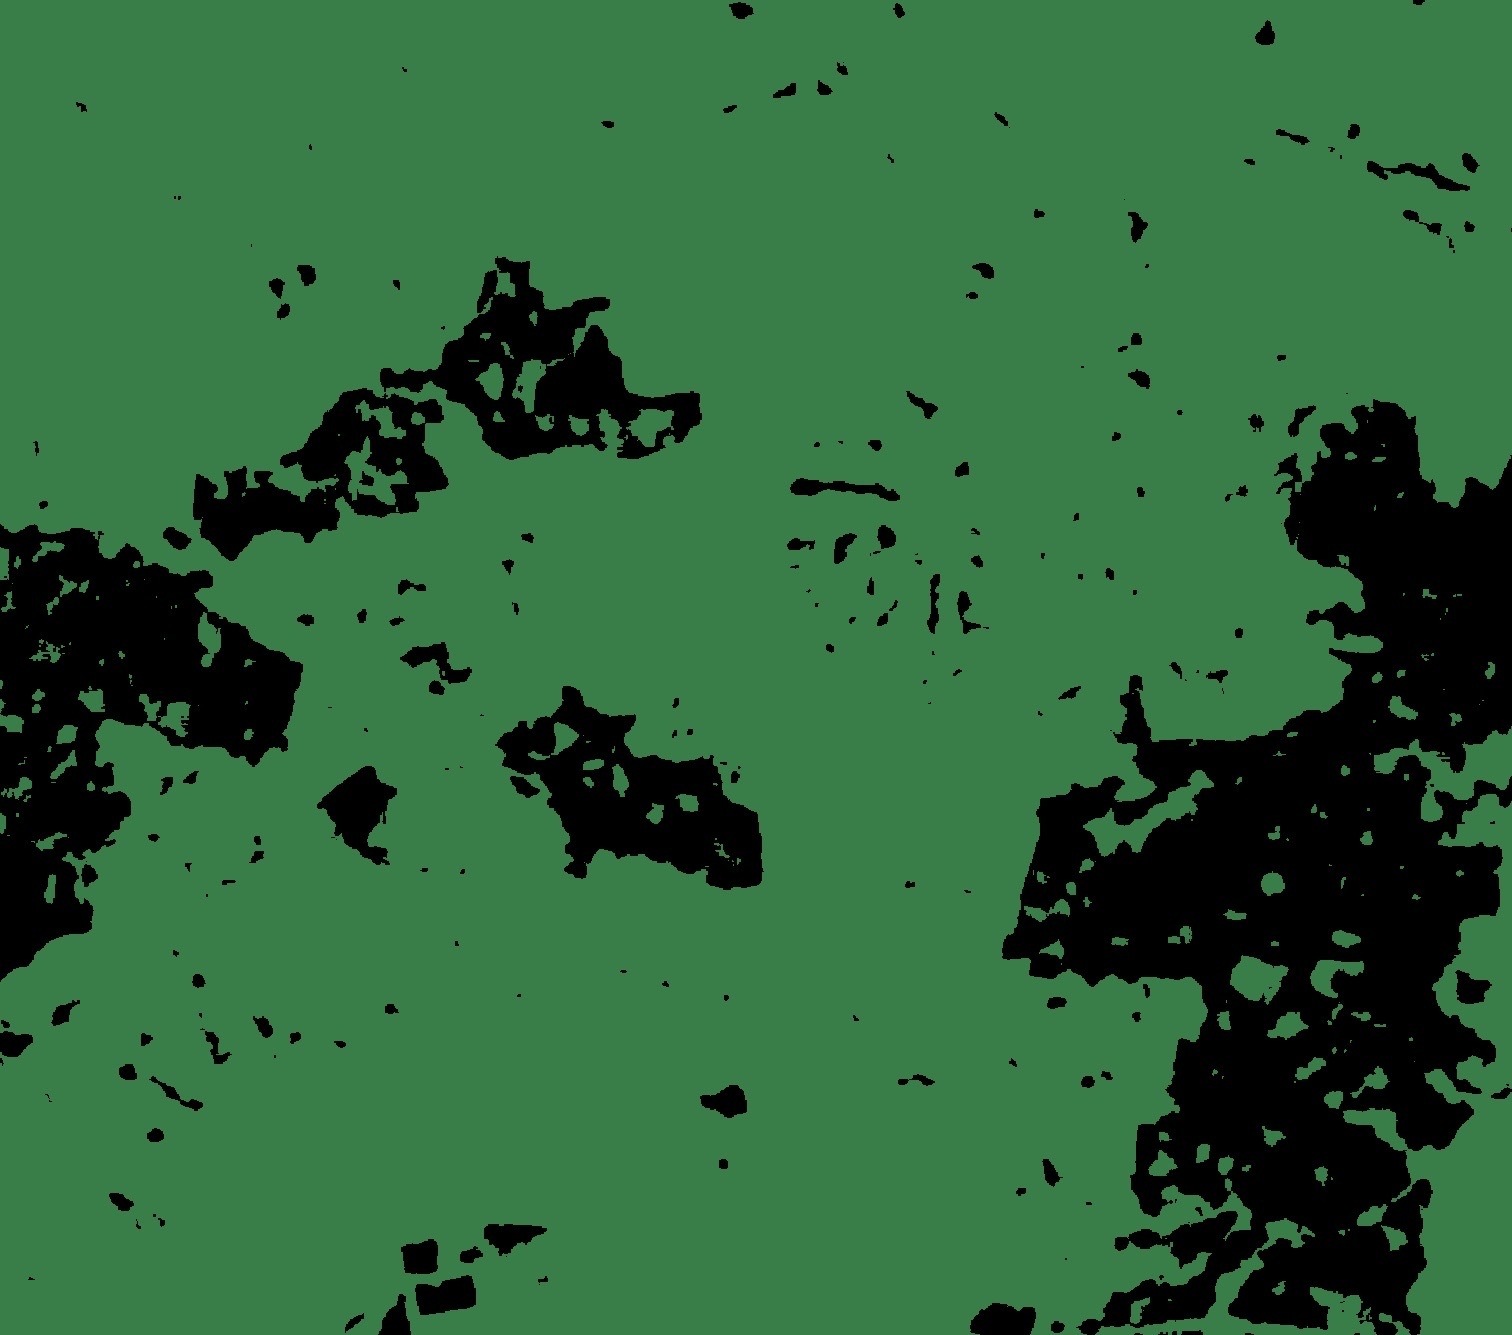
Fig 3 : Forest cover for a piece in Jan 2020 (left) vs Feb 2020 (right)
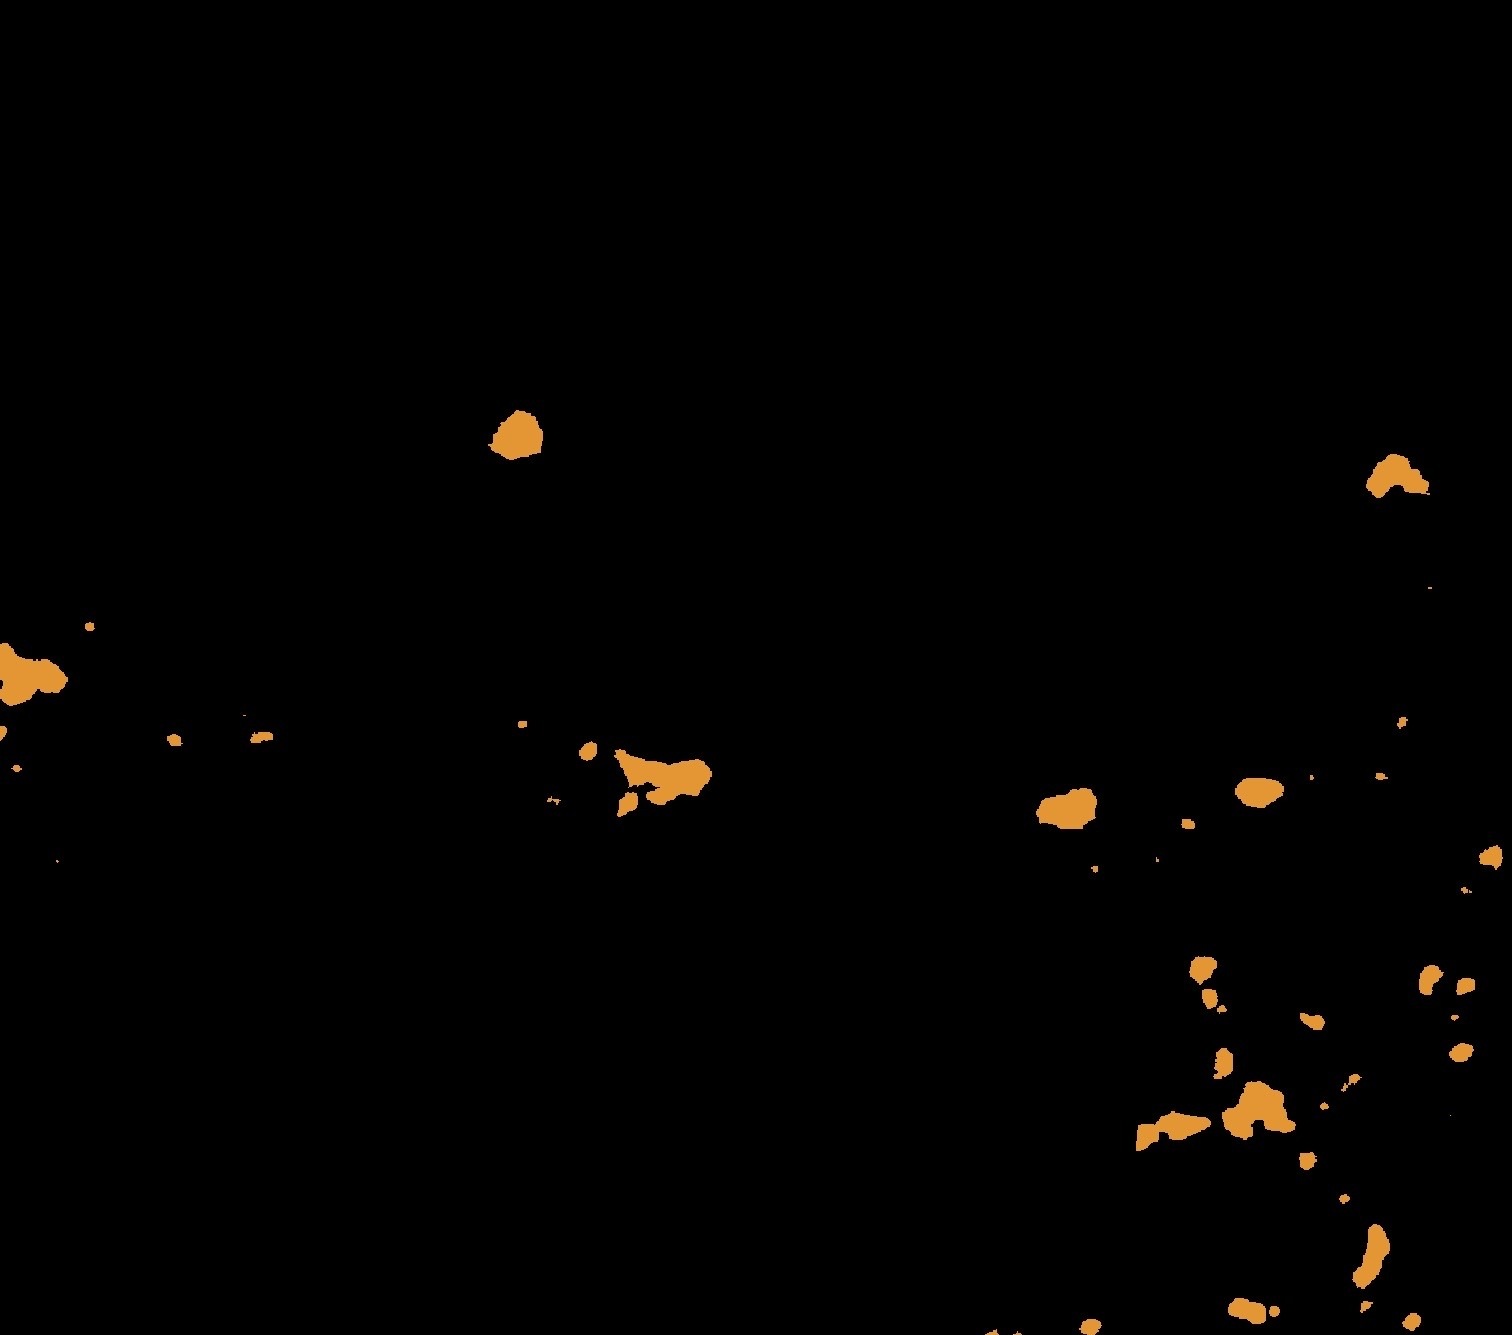
Fig 4 : Crop cover for the same piece in Feb 2020
Processing the Images
In order to get the area where forests have been cut and the land is being used for farming, we do the following steps:
- We first find the area deforested by subtracting the forest cover for the two months
- Then we intersect that with the crop cover to find out the area where there has been deforestation and crops are planted
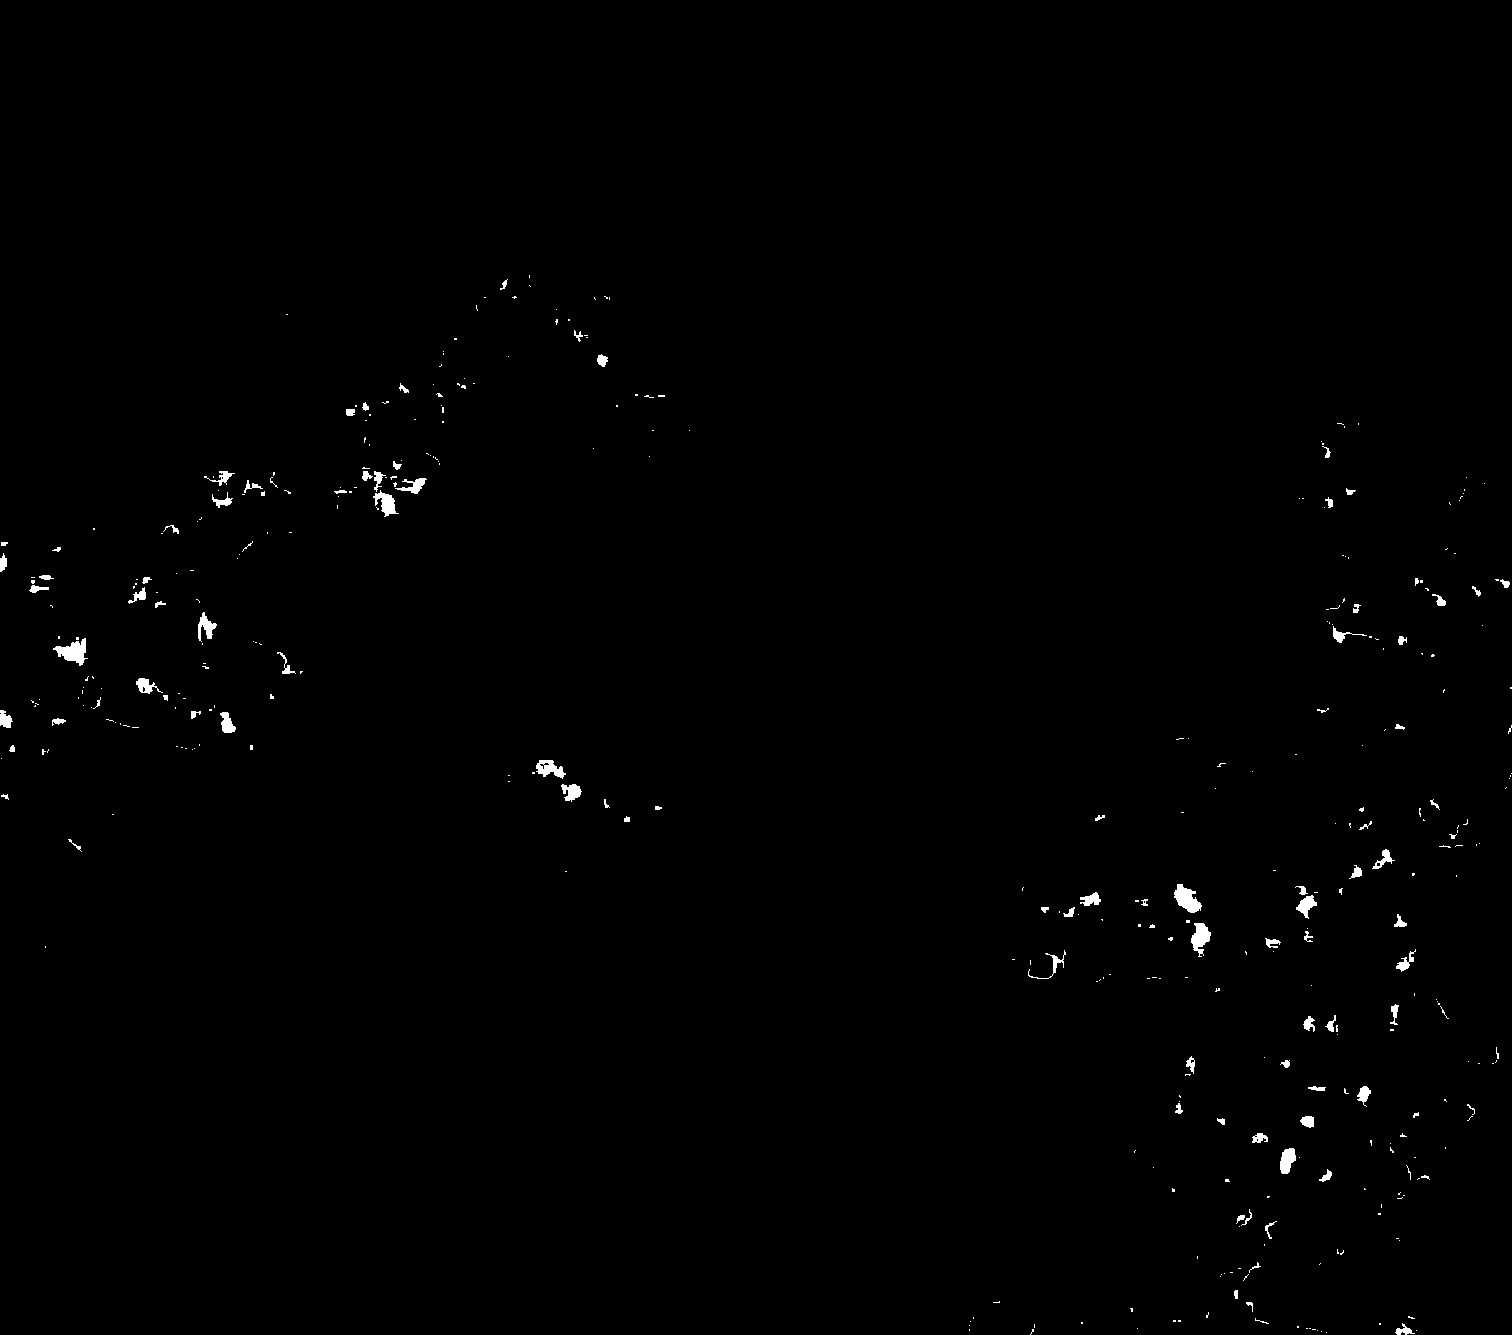
Fig 5 : For the above scenario, the processed image looks like above
Next challenge is to decide which coordinates to point out, as we might only need to identify the locations with a certain area threshold of deforestation for practicality.
We use the below criterion to figure out those coordinates:
- We create a square of n pixels and if all the pixels in the square satisfy our criterion, we give the centre of that square as one of the outputs.
- Area per pixel for this image is 65.67 sq. metres. So basically this sets a threshold of deforestation to 65.67* sq. metres for being reported.

Fig 6 : As seen in the above image, the squares with yellow boundary are the areas to be reported
Generating Output
Till now we have the pixel values of the image denoting the area of deforestation. To convert them into latitude and longitude coordinates, following steps are followed:
- To get the latitude and longitude of the centre of these squares, we use unitary method on the pixel location of the centre
- Compare it with the edge coordinates of the piece to get the coordinates of the centre.
- Last thing is to make sure that we are only pointing out the coordinates that are actually in our region of interest(as the individual piece of the shapefile may contain some region with which we aren’t concerned).
- For that we just check whether the centre of the square box lies within the shapefile or not.
Finally, these coordinates can be shown in a map based UI
Conclusion
This product can be leveraged by the stakeholders in detecting deforestation and the land usage. This can go a long way in the protection of both fauna and flora, as well as a big step towards a sustainable human-wildlife relationship.
Reference

Vaibhav Singh
Data Scientist
Vaibhav Singh is a Data Scientist with 4 years of experience in analytics, modelling and cloud technologies. He has worked in a wide range of domains such risk management, demand planning, health care and wildlife conservation. Alongside, he also has keen interest in exploration of upcoming technologies such as LLMs and IIoTs with a continuous passion for learning and implementation.